New USGS Streams Gauge Page for Pennsylvania

DaveKile

Administrator
Staff member
Joined
Dec 13, 2021
Messages
7,564
City
Pennsylvania
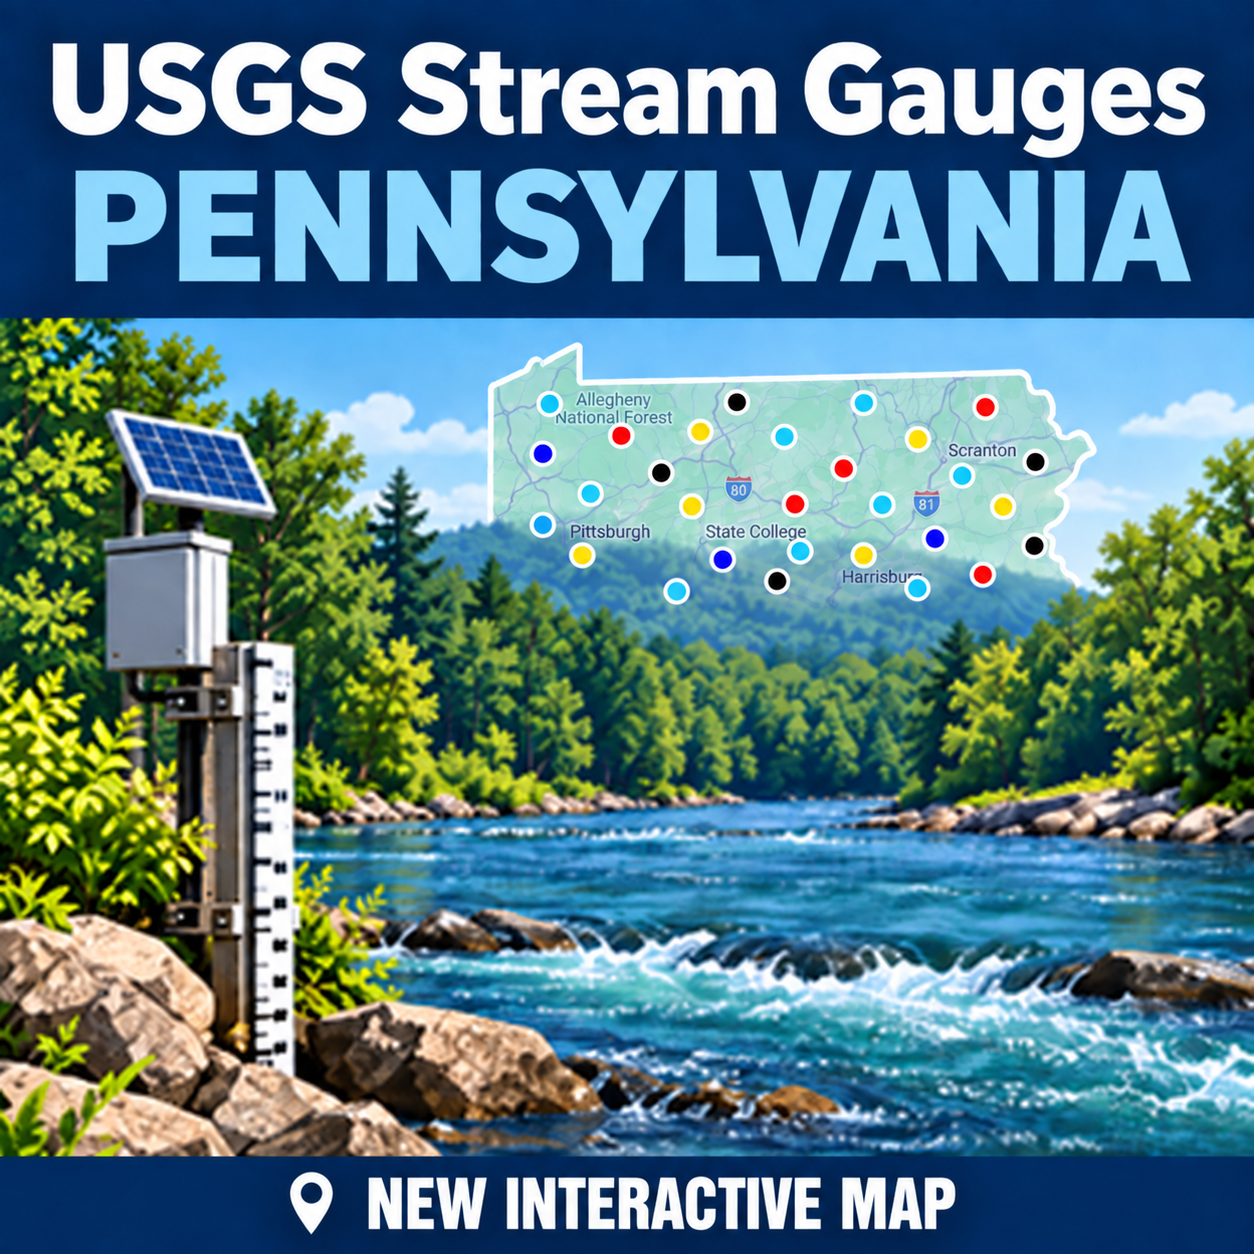
The USGS implemented many new updates to their USGS Water Monitoring Pages over the last few years. The biggest part of this was decommissioning many older pages and services that just don't work anymore. Trying to make lemonade out of the situation I have added a new page on Paflyfish since the table page is no longer available. The new USGS Streams Gauge Page for Pennsylvania actually offers some new data on the page with a paired done table of streams more focused on fly fishing streams in the state.

Other enhancements:
  • Streams organized to six regions in the state
  • Regional toggles to minimize the about of streams displayed
  • Stream level 2 hr trend with new visuals for faster reading
  • Water temperature converted to Water Temp (°F)
  • Air Temperature readings from the National Weather Service
  • Links from the site name to Google Maps
  • Links from the station # to the USGS Station page
  • Fixed - sticky-header behavior for desktop computer 9/11
  • Updated for improvements on mobile devices in horizontal view 9/11
Future plans will be to add an embedded map with visuals and links to the sites. Individual popups or pages with some faster and easier access to the stream levels...I hope.

The new page can be found in the Content menu above or on the righthand sidebar with big new shining badge USGS Real-Time Water Conditions for Pennsylvania.
 
Last edited:
Thx! Fwiw I have the found this page useful for getting an overview, but it buries the temp info you’ve extracted.
 
Dave,
Thank you for your work providing this information. I can see the temperatures on the right side of the page. This will be very useful.
 
Dave,
Thank you for your work providing this information. I can see the temperatures on the right side of the page. This will be very useful.
Thanks for your positive feedback and acknowledging that detail. I hope to continue improve on what we have so far.
 
Thx! Fwiw I have the found this page useful for getting an overview, but it buries the temp info you’ve extracted.
Thank you and I have been following with the USGS has been doing over the past several years. They have never been really good at providing embedded options to what they're doing. I continue to look but not find anything that's constructive for trying to do here at Paflyfish.

I know you have done some really good maps and projects on your own. I may have to try to come up with what you've just provided which matches my vision of what I wanna do and create my own page just like that it may take me a while.
 
The USGS implemented many new updates to their USGS Water Monitoring Pages over the last few years. The biggest part of this was decommissioning many older pages and services that just don't work anymore. Trying to make lemonade out of the situation I have added a new page on Paflyfish since the table page is no longer available. The new USGS Streams Gauge Page for Pennsylvania actually offers some new data on the page with a paired done table of streams more focused on fly fishing streams in the state.

Other enhancements:
  • Streams organized to six regions in the state
  • Regional toggles to minimize the about of streams displayed
  • Stream level 2 hr trend with new visuals for faster reading
  • Water temperature converted to Water Temp (°F)
  • Air Temperature readings from the National Weather Service
  • Links from the site name to Google Maps
  • Links from the station # to the USGS Station page
  • Fixed - sticky-header behavior for desktop computer 9/11
  • Updated for improvements on mobile devices in horizontal view 9/11
Future plans will be to add an embedded map with visuals and links to the sites. Individual popups or pages with some faster and easier access to the stream levels...I hope.

The new page can be found in the Content menu above or on the righthand sidebar with big new shining badge USGS Real-Time Water Conditions for Pennsylvania.
Thanks, Dave, it's so nice of you to gather all that information in one link, very handy.
 
I am open to adding or deleting some USGS stations on the list. For a variety of technical reasons the list needs to be in the 120+/- range. The full list of the state is 370+ which is overkill for individual use and causes technical problems for me.

If you think there should be a change, let me know, but please include name and station #. I need something more than some vague regional adjustments or I did it wrong. Example of how not to do it - Why I didn't do every station on the Allegheny? While I do enjoy reading those kind of posts and it really motivates me, details matter.
 
Do these new sites show water clarity? I thought I read somewhere that 7.0 or below is clear enough to fish.
Sorry but not something I have answer for you. You'll need to do some snooping on your own.

Primary project goals are a manageable list of mostly fly fishing streams, water temp gauges and then adding NWS air temps that in total that doesn't cause major site issues here and an a reasonable programming effort.
 
Thank you and I have been following with the USGS has been doing over the past several years. They have never been really good at providing embedded options to what they're doing. I continue to look but not find anything that's constructive for trying to do here at Paflyfish.

I know you have done some really good maps and projects on your own. I may have to try to come up with what you've just provided which matches my vision of what I wanna do and create my own page just like that it may take me a while.
I had a past version that showed current stream temps and trailing stream temp graphs in the popup, but after their many shenanigans I gave up. Now it only shows the current levels, and graphs if available.

Unrelated, but I also just noticed that arcgis has started displaying json uploads in the navigable mobile app, which is new. So now the many thousands of public parking locations I uploaded are viewable - and navigable - from mobile devices.
 
Last edited:
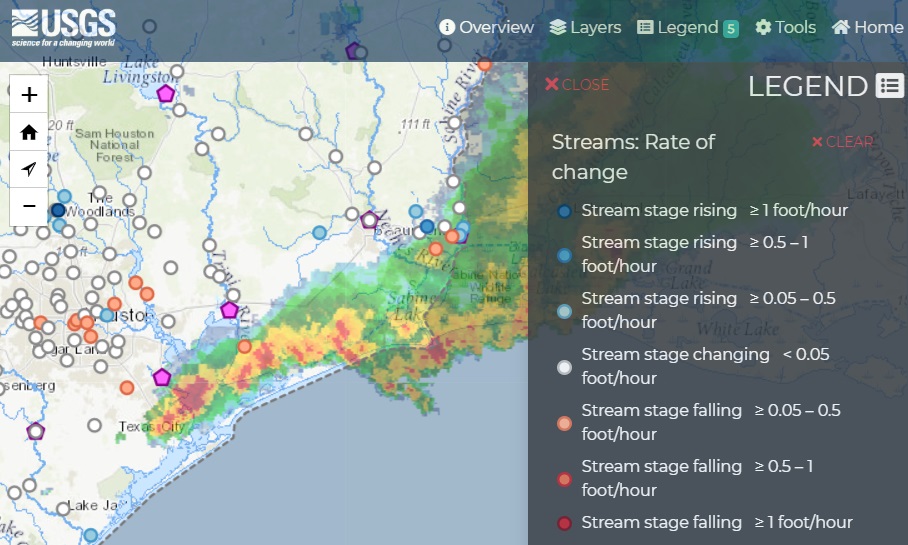
Apologies for clogging your thread, but found the colored dots data on arcgis, tried to color the dots like the Pa published map, added flow info in m3/s (no cfs sorry) and updated map. Still no temperature info though. Oh well. IMG_0209.png
 
Last edited:
Apologies for clogging your thread, but found the colored dots data on arcgis, tried to color the dots like the Pa published map, added flow info in m3/s (no ft/s sorry) and updated map. Still no temperature info though. Oh well.
always glad to have you share you work here and you are not clogging up anything. You really need to provide all of us a new link. Maybe even put in your signature so we can all see it more often?

I'm not looking forward to on trying to get to pop-ups. That's a 400 level class. My next step will be an embedded maps much like the USGS map you showed. Gonna have to be hosted elsewhere and embedded here. So I'm looking to see how Google Maps will work with this. I spent most of the winter figuring much of the baseline for all these dispart datasets and now bringing it all together. Actually there is not only the API's from USGS and NWS, but Google too is nuts. Then having to integrate Xenforo protocols (forum platform), plus Python, CSS, Javascript, and HTML.

I learned BASIC on a Pet Commodore computer in 1977 and this stuff is way beyond my anything my 14 year old brain can handle. Thank goodness for ChatGPT and Codex or none of this would work.
 
  • Like
Reactions: Kms
always glad to have you share you work here and you are not clogging up anything. You really need to provide all of us a new link. Maybe even put in your signature so we can all see it more often?

I'm not looking forward to on trying to get to pop-ups. That's a 400 level class.
Since it looks like I could only add one link to my sig, I added a link to the post with both map links. But… I have no idea how to add my sig to posts, lol.

None of my stuff is 400 level. I’m just a hack. Arcgis is robust and pretty intuitive once you play with it.
 
Back
Top