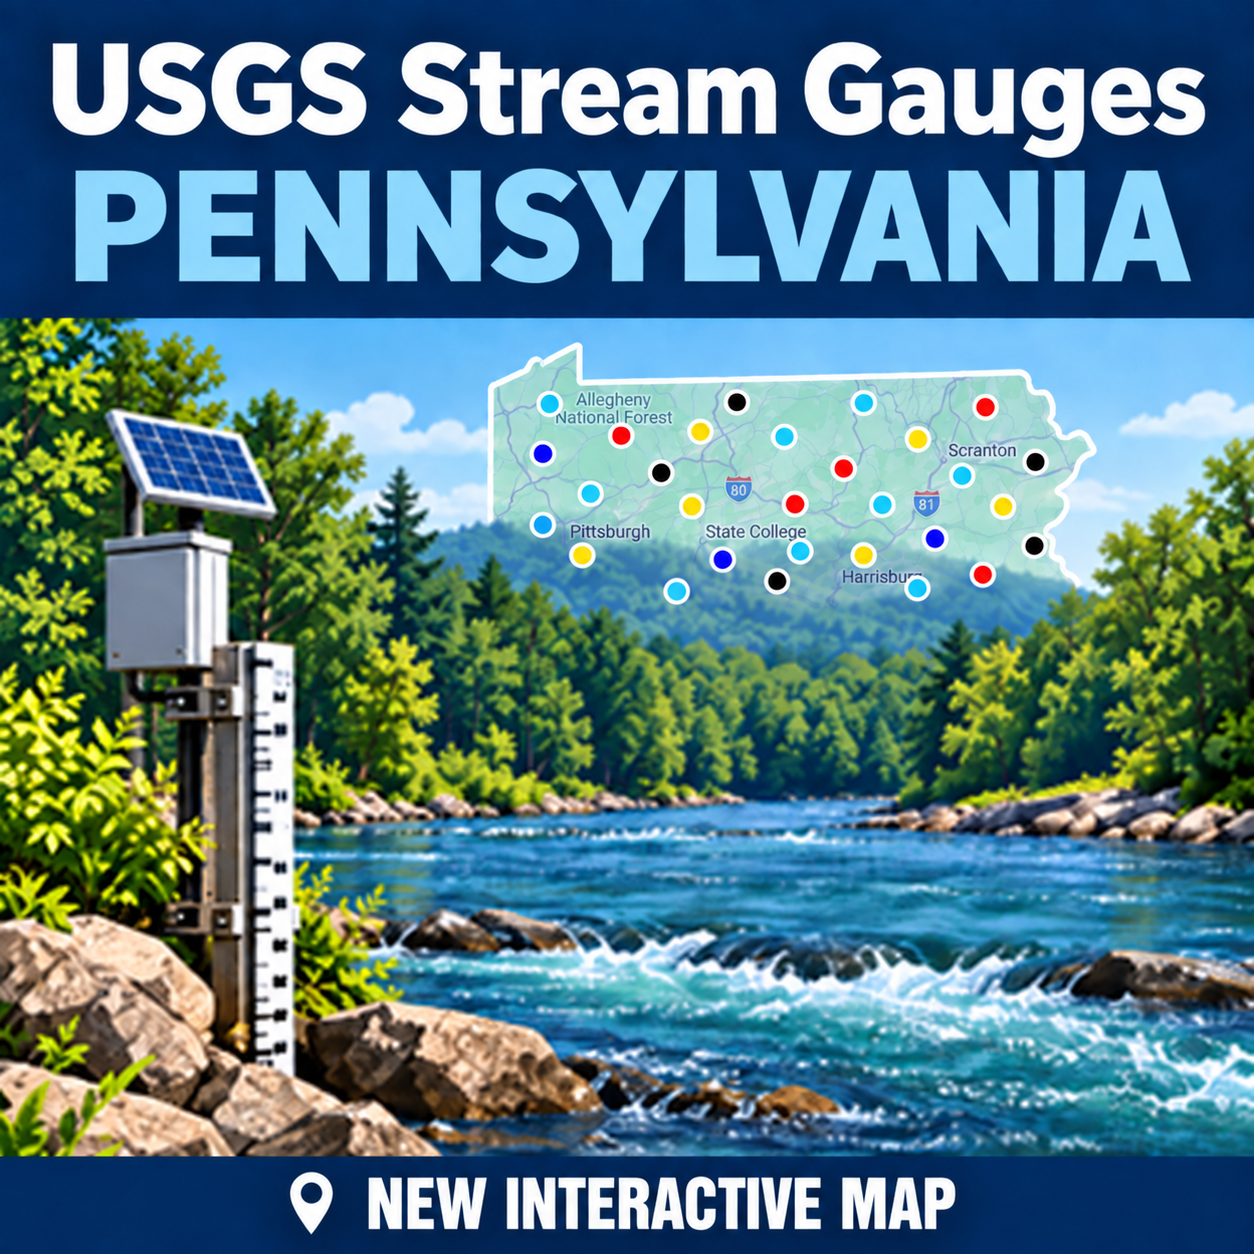
New USGS Streams Gauge Page for Pennsylvania

The list is very good.
Suggestion would be if a used could minimize the regions that one is not looking in. FWIW

If I understand your statement, the arrows to the left of each region were setup as toggles with hide and show.

Screenshot 2026-09-13 at 3.54.03 PM.JPG
 
I would like to wrap up any adds or deletes to the list before I move on. Providing explicit station names and station # are critical for me. Here is a full list.

I'm mostly interested in the bigger rivers. I can have a few stations for a larger river, but not all of them.

Adding
West Branch Susquehanna River at Bower, PA - USGS-01541000

Deleted
Girtys Run above Grant Avenue at Millvale, PA - USGS-03049819
 
Last edited:
  • Like
Reactions: Kms

This does work, but not nearly as well as before.

The ideal scenario would be:

1) As you hover over the dots on the map, the stream and location info should appear.

2) Then you click the dot to select the gauge and the chart with the flow rate (cfs) for the last 7 days is displayed.

IMHO, the default should be CFS, not gauge height. I think cfs is more intuitive, more meaningful than gauge height.
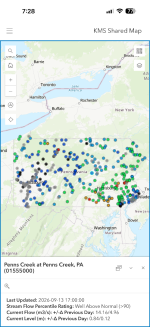
I’ve added the colored dots to my shared map. The only source I have for USGS data is metric (Canadian) - so no cfs, sorry - but at least the color levels come through. Flow vs height data are a function of what the gauge reports, but both are displayed if you tap a dot, along with change from previous day.
IMG_0215.png
 
Last edited:
I used to reference the gage at pocono creek / wigwam. It was in cfs. It is now only gage height but they baseline the graph at 9ft. Pocono is a smaller stream and 9ft would be a catastrophic amount of water. I now reference the brodhead gage and figure a comparison flow. UGSS really made some of these gages difficult and almost useless. You did a good job Dave.
 
I used to reference the gage at pocono creek / wigwam. It was in cfs. It is now only gage height but they baseline the graph at 9ft. Pocono is a smaller stream and 9ft would be a catastrophic amount of water. I now reference the brodhead gage and figure a comparison flow. UGSS really made some of these gages difficult and almost useless. You did a good job Dave.
Thank you. Working on features and locations that will best serve the whole fly fishing community.
 
This is a great service @DaveKile! Love seeing the trend statement (rising/steady/falling), since that's usually the key info I'm looking for.

Totally as a source of amusement, someone mapped all the river flows as a visual tool here: https://norway-charts.netlify.app/river_flow_map_usa/

(NB: the map does not pinch-to-zoom. Took me an embarrassingly long time to find that Cmd-scroll [Mac] up/down zooms in/out.)

 
This is a great service @DaveKile! Love seeing the trend statement (rising/steady/falling), since that's usually the key info I'm looking for.

Totally as a source of amusement, someone mapped all the river flows as a visual tool here: https://norway-charts.netlify.app/river_flow_map_usa/

(NB: the map does not pinch-to-zoom. Took me an embarrassingly long time to find that Cmd-scroll [Mac] up/down zooms in/out.)
Thanks for the feedback and sharing of the other map. A strong visual representation of the USGS data. It’s good to see some alternative interpretations of the maps. The USGS left us for years with and still do with very limited user interfaces. They never have lacked a lot of imagination.

I’m hoping to get a version 1 rolled out this fall of a final product. After that consider improvements and add on down the road.

All ideas welcome
 
I have a new unreleased version of the streams gauge I have been putting together. I have it set up on a test page to preview. The station popups have not been implemented yet. Once I see that this test version is working I will be proceeding to adding and testing station popups from the map.

You are more than welcome to test drive and see if there are any issues. Thank you for your help.

Currently the new Beta version below added
A map with streamflow indicators matching USGS
User Interface enhancements
Fixed caching issues
Fixed reload issues for desktop and mobile
Fixed a refresh button issue
Plus many other know issues

Old page link removed

(Screenshot below)
Screenshot 2026-09-25 at 9.56.50 AM.JPG

(This link may be change or deleted)
 
Last edited:
  • Like
Reactions: Kms
New version complete Beta V2.9.2
This is the version with popup station gauges working for desktop and mobile devices. Once all the bugs get fixed, this will be a released version for the site.
Primary features in this version:

Desktop
Rollover for markers showing gauge name, station #,county and region
Selecting marker provides popup box with naming info, current conditions, CFS, 6 hr discharge graph, gauge ft, water temp (if available ), air temp, links to outside data

Mobile
No rollover functionality
Selecting marker provides popup box with naming info, current conditions, CFS, 6 hr discharge graph, gauge ft, water temp (if available ), air temp, links to outside data

Use the Refresh Conditions if there are map or table loading issues.
If you encounter any bugs or issues please let me know here in this thread. Thanks for your help.

Known issues
iPad loading popups not working - fixed
Some loading issues of the markers on the map - use Refresh Conditions


Screenshot 2026-09-28 at 11.31.37 AM.JPG
 
Last edited:
  • Like
Reactions: Kms
Back
Top