Blue Liner Flows Review | USGS Stream Gauges

IMG_3629.jpeg
Traveling more than an hour to go fly fishing often requires some planning. Weather and water levels are the two most important variables to understand before heading out. Everyone has their favorite weather apps, but this year more than ever, having a good understanding of water levels has been non-negotiable.

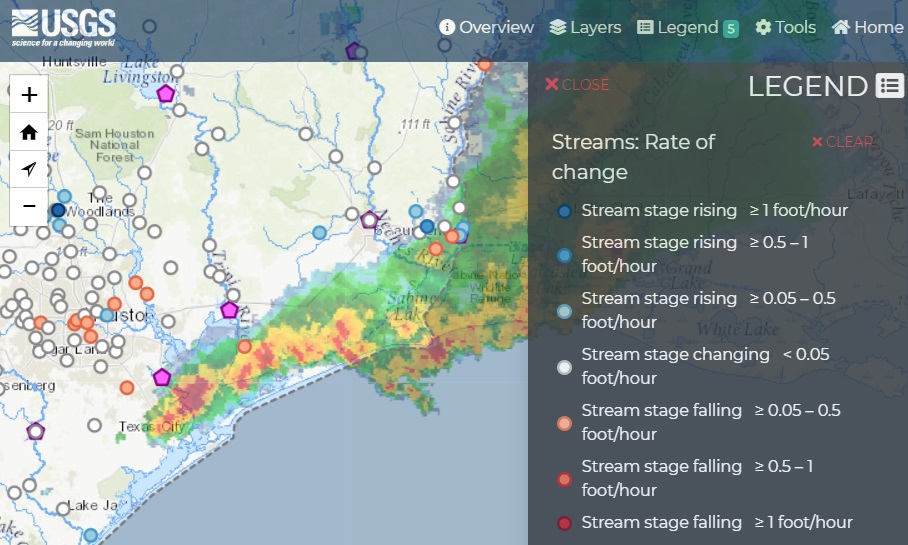
All water level data originates from the United States Geological Survey (USGS) Surface-Water Data, which monitors over 13,000 stream gauges across the U.S. and more than 350 in Pennsylvania. The USGS has been transitioning to a new online interface over the past five-plus years. The updated look and feel have left some old features behind while adding new ones. I hate it.

So, I’ve been on the hunt for a desktop and mobile app that delivers USGS backend data through a clean, easy-to-use interface. Blue Liner Flows offers a solid solution for iPhone, iPad and Mac users, with apps built for both platforms. Most importantly, favorites and preferences sync across devices. There’s a free version, but I’ll be reviewing the $6.99 annual paid version.

Key features include: favorites, state selection, map view, latest data overview, discharge in CFS, discharge in feet, average annual discharge, various time views, weather forecasts, alerts, temperatures (station-dependent), turbidity (station-dependent), and other data specific to each gauge.

I found the app very easy to set up on my Mac. Once configured, all my favorites and alerts synced automatically to my iPhone. You don’t need both devices—an iPhone alone works just fine. I especially liked navigating between the state, favorites, and map views. It’s fast and intuitive. Most views display the key information I’m looking for, including directional arrows indicating whether water levels are rising or falling.


Screenshot 2025-06-18 at 5.43.55 PM.JPG

Screenshot of the Mac Desktop Version


Setting up favorite streams, alerts, and other preferences is straightforward. The map view is much quicker and more efficient for visually scanning your favorite gauges in one place. Data updates arrive promptly.

Charts come pre-smoothed with trend lines. That’s not my preference, but it’s not a dealbreaker. The one thing I’d like to see improved is the ability to view data from farther back than two months. While it does show a one-year historical average, a longer discharge record would be valuable.

Overall, this app is a winner thanks to its easy setup and user-friendly interface. It provides timely data before you even reach the stream. There is a free version to try out on Apple App Stores.

Another good cross-platform alternative for iPhone and Android users is RiverApp.

What stream gauge app do you prefer?
 
Last edited:
I just use the website, typically I've got some time at work, or home in advance I can just bring it up on my laptop.

I just have browser bookmarks for my state flow picture, and for the river(s) that I frequent. I don't hate it.
 
I just use the website, typically I've got some time at work, or home in advance I can just bring it up on my laptop.

I just have browser bookmarks for my state flow picture, and for the river(s) that I frequent. I don't hate it.
Same here. I frequent the same 3 places and just have bookmarks for them. The few times I do fish somewhere different it's not a hassle to just manually search it.
 
The Rivercast App is cross-platform for IOS and Android. It's my preferred mobile solution. You pick a site off a map and get the flow details.

I also have the Rivers.Run app, also cross platform. This is more tailored to whitewater enthusiasts, but gets the job done for a fly fisher too...
 
The Rivercast App is cross-platform for IOS and Android. It's my preferred mobile solution. You pick a site off a map and get the flow details.

I also have the Rivers.Run app, also cross platform. This is more tailored to whitewater enthusiasts, but gets the job done for a fly fisher too...
The free River Stages app for the iPhone is also useful. Unintuitive interface, and it shows the familiar usgs data, but when you tap on a favorite the first clip links to stream info on water.noaa.gov, which shows official and modeled forecasts where available, something I hadn’t noticed in any of the other apps
IMG_5530.jpeg
 
Last edited:
I like the USGS Water Dashboard:

It has loads of layers, and most importantly overlays the radar and storm total precip, the temp and pressures, etc etc.

It has some mobile limitations but it is free.
 
I like the USGS Water Dashboard:

It has loads of layers, and most importantly overlays the radar and storm total precip, the temp and pressures, etc etc.

It has some mobile limitations but it is free.
Never noticed that page before. Very nice. Thanks!
 
Last edited:
Back
Top