afishinado
Moderator
Staff member
When you make a decision where to go on your next fishing trip, always check the flows for the stream or river you are looking to fish.
Bookmark this page > USGS Streamflow PA
The page above gives near real-time reading of flows for nearly every PA stream sorted by major river basin and listed by region in the state. You can pull up this same page for any state.
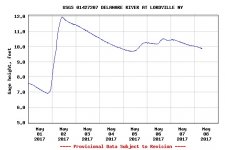
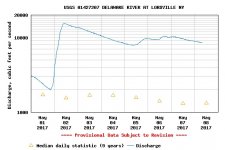
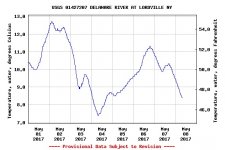
The first number on the stream listing page contains the current gage height, next the current flow reading in cfs (cubic feet/second) followed by the long-time median flow for that date. Some gauges contain the current temp (the last number if present) in degrees celsius. When you click on the actual chart, the temps are converted to fahrenheit degrees on the right hand side.
Click on the stream or river and you will see a chart for the gauge height and flow in CFS. In the flow chart the long-term median height will be marked with a triangle. Clicking on the individual stream will allow you to track the flow pattern for the past week. You can also insert different date parameters to track the flow or temps for different time periods as well as past history.
After you fish a stream a few times, you will become familiar with how the stream fishes at what level. But, if you are not familiar with a stream, as a general rule, in the springtime with higher average flows, a flow close to or even a bit below the median flow is often good fishing level. In the summertime, when flows are usually lower, a reading near the median or a bit above may be a good fishing level.
Flow readings way above the median means high water conditions for wading and floating and possibly off-color water; you may want to look for streams in better shape. The same for the summertime conditions when low flow and higher temps are indicated in the charts.
Below are examples of the flow and temp charts:
Bookmark this page > USGS Streamflow PA
The page above gives near real-time reading of flows for nearly every PA stream sorted by major river basin and listed by region in the state. You can pull up this same page for any state.
The first number on the stream listing page contains the current gage height, next the current flow reading in cfs (cubic feet/second) followed by the long-time median flow for that date. Some gauges contain the current temp (the last number if present) in degrees celsius. When you click on the actual chart, the temps are converted to fahrenheit degrees on the right hand side.
Click on the stream or river and you will see a chart for the gauge height and flow in CFS. In the flow chart the long-term median height will be marked with a triangle. Clicking on the individual stream will allow you to track the flow pattern for the past week. You can also insert different date parameters to track the flow or temps for different time periods as well as past history.
After you fish a stream a few times, you will become familiar with how the stream fishes at what level. But, if you are not familiar with a stream, as a general rule, in the springtime with higher average flows, a flow close to or even a bit below the median flow is often good fishing level. In the summertime, when flows are usually lower, a reading near the median or a bit above may be a good fishing level.
Flow readings way above the median means high water conditions for wading and floating and possibly off-color water; you may want to look for streams in better shape. The same for the summertime conditions when low flow and higher temps are indicated in the charts.
Below are examples of the flow and temp charts:
")