Intrepreting stream flow numbers

Six-Gun

Six-Gun

Member
Joined
Jul 30, 2013
Messages
427
I have spent more and more time reading the USGS streamflow/cubic feet per second figures for my local waters and have slowly come to realize that I'm not really well-educated in this regard. I see a number for a given stream one day and can tell if it's had major runoff or heavy rain causing a sudden spike, but that's about it. I have no idea what else I can glean from the figures seasonally or how to tell if now is a good time to fish other than "it shouldn't be blown out because there was no major precip or snow runoff."

A lot of people I hear around here and elsewhere can tell that a particular stream is getting good because it's a "X" cfs. I simply have no clue what the logic behind their reasoning is, merely trusting that they know what they're talking about from past experience. I presume it's a relative thing that varies significantly from stream to stream, of course.

How can I make the graphs and the number they present more useful to me? I figure that there has to be more to it than that.
 
Six-Gun wrote:
I have spent more and more time reading the USGS streamflow/cubic feet per second figures for my local waters and have slowly come to realize that I'm not really well-educated in this regard. I see a number for a given stream one day and can tell if it's had major runoff or heavy rain causing a sudden spike, but that's about it. I have no idea what else I can glean from the figures seasonally or how to tell if now is a good time to fish other than "it shouldn't be blown out because there was no major precip or snow runoff."

A lot of people I hear around here and elsewhere can tell that a particular stream is getting good because it's a "X" cfs. I simply have no clue what the logic behind their reasoning is, merely trusting that they know what they're talking about from past experience. I presume it's a relative thing that varies significantly from stream to stream, of course.

How can I make the graphs and the number they present more useful to me? I figure that there has to be more to it than that.

You have it in the above paragraph. When I fish a particular stream or river, I can relate the gauge height to the level at which I've fished before. All this is pretty much in my head (not the best place for it all the time :roll:). You may want to consider recording the flow and rating it on a scale of fishabilty in your computer or in a written journal.

One other thing; every gauge has an average for that date (those little triangles thingies on the graph). Even if you've never fished the stream or river, you can use the average for that date to determine if the stream is high, low or average for that date. Remember though, in most cases the average, say the late summer, will be a lot lower than the average in the early spring.

HTH
 
It's mainly from experience. You'll start to recognize a range of CFS when the stream fishes well. The local fly shops may be able to offer some guidance; the guys in the shop will be gauge watchers and should have a good understanding of the relationship between the gauge readings and the fishing conditions. Once you begin to understand the gauge readings for a particular river, you'll also develop an understanding of how quickly the particular stream will clear after a rain event (this will vary based on the amount of rain, the season, and how much rain has fallen recently). It may not have anything to do with the averages. A good general rule; when there are no recent spikes the fishing should be good even if the water is high or low relative to the average (assuming the gauge is working properly). Another thing to be aware of; the gauges can freeze in the winter and may not be reliable. This too is something you'll begin to figure out with experience. If you have a long stretch of cold and the gauge is doing something suspect, it is probably frozen and giving false readings.

PM me if you have questions about the rivers in NE Ohio and NW PA.
 
I been watching and using the USGS data for a long time. It can be useful but I agree with what everyone else has said regarding it takes some time to be able to internalize the data into something meaningful.

For the rivers I fish, I know at what point I can or can't wade. If you are just getting started, it may be helpful to keep a log every time you visit a river. Record you observations (river was pretty low) along with the data from the USGS site. You'll soon figure out some benchmark values to which you can readily relate.

There is a short cut, some fly shops give stream condition reports and reference the USGS data. Often times they will provide guidelines along with the report, i.e. river is unwadable over xyz.

I think it is worth the time to invest, particularly if you have a couple hour drive to your favorite fishing hole. The data can help you decide if it will be worth the trip.

have fun,
 
As others said, it comes from experience.

You said you've been looking at the gauge for your local stream. Just look at the gauge every time you go fishing, or even drive by the stream and start comparing the cfs on the gauge to what you see on the stream.

Eventually you will get a rough idea of what levels are:
1) too high
2) too low
3) the range in between, where its good to fish.
 
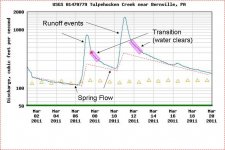
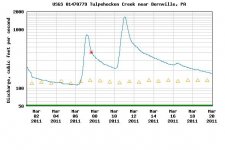
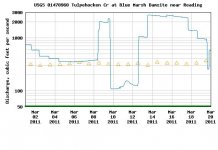
Flow vs. clarity is another issue, and you can use the graphs to guestimate that. Yeah, when you get a spike, you usually get muddy too. But it's not as simple as saying that X cfs = a certain level of clarity. A really big spike clears at a higher cfs, maybe above what a little spike looks like.

I'll try to show some graph examples I set up for the newbie jam when I get the chance. But look at the end of the spike. Usually you get an area where it's really beginning to level out. It may not be back down at "pre-rain" levels, but where the line is transferring quickly from mostly vertical to mostly horizontal. That's the point where you are transitioning from mostly runoff to mostly groundwater (which may be charged up). So you will be clearing, and temperatures reverting to standard for the stream, etc.

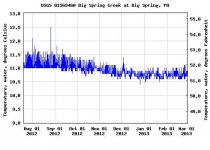
That also tells you what kind of a stream it is. How steady is the groundwater? On a stream with a stable "base" flow like many limestoners, those horizontal areas between rains will be nearly flat. On a freestoner with poor water residency times, even the flat "base flow" areas will be pretty slanted. Probably not the place you want to go if it hasn't rained a drop in 3 weeks.

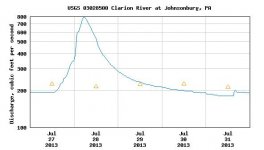
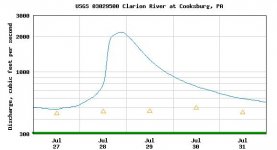
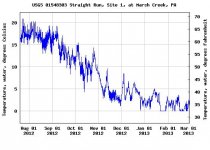
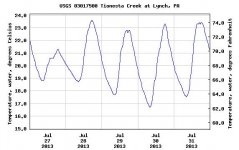
You can also look at historical data by plugging in dates. Look for clean spikes, meaning rain and done. This tells you how the stream responds to rain. How quickly it rises and falls. And compare dates with upstream and downstream areas. Do it for the same season in question, as it does change a little from summer to winter, etc. In general, bigger streams rise and fall slower, with broader, smoothed peaks. Small streams rise and fall quickly, and are more "spiky".

And the effect is delayed. i.e. a large stream may not even begin to rise much until the day after, by which time it's tribs are already dropping back to normal. You can see by how much.

You can use this in planning ahead. So if you see you're supposed to get 0.50" of rain tomorrow, and your planning a big trip. You can look up several gauges in the watershed, or a nearby one, and look for a similar event in a past year. And thus predict how each stream will respond and plan your trip. i.e., you can say, ok, during the rain I'll fish the big water on day 1, while it's raining, which won't have risen yet, while the little streams will blow out almost immediately. On day 2, that big stream will be rising fast and the medium sized tribs are blown out, but this little trib (and others of it's approximate size) will be just getting back to fishable. Perfect. On day 3, the little one will be on the low side, and the big one still blown out, but the medium ones will be optimal. etc. etc.

For tailwaters, you can also see how they manage the dam, especially if you have a gauge above and below the dam, and on the next stream down. It's very common that BEFORE an expected rain, they let a lot of water out and lower the pool. When the rain hits, they wait till the incoming water starts spiking, and then start holding back, making the outflow lower. When the water WAY downstream starts dropping, then they increase the flow again.

Knowing what to expect is a key to success in fishing. With some logic, you can get fairly good at predicting. It's still based on logic, not gauges, but the gauges in essence calibrate your predictions.
 
Example of typical runoff freestoner flow, with descriptions added by yours truly.


Attachments

  • flows.JPG
    flows.JPG
    71.9 KB · Views: 6
Example of Clarion river in upstream and downstream locations from the same dates. Both are still reasonably sized, not little tiny streams. But upstream is smaller than downstream. These are for the SAME rain event, and most of the rain came on the 27th.

Note that the spike is sharper and shorter upstream. Get a smaller stream, and it's sharper and shorter yet.

Also, notice the offset. The upstream location peaks just as the downstream location begins to see minor effects. The upstream location is becoming fishable by the time the downstream location peaks.

While the "upstream" location peaks, an even farther upstream location would have been becoming fishable again.


Attachments

  • clarion river_upstream.JPG
    clarion river_upstream.JPG
    23.7 KB · Views: 3
  • clarion river_downstream.JPG
    clarion river_downstream.JPG
    23.8 KB · Views: 3
Example of Blue Marsh dam, both the incoming water and outgoing water. Shows how a typical flood control dam adjusts outflow to rain events.

They keep the outflow reasonably low during peak flow to prevent flooding downstream.

As soon as the incoming streams drop, they boost the output WAY up to try and get rid of that water in time for the 2nd event.

As soon as it hits, they lower the outflow again to prevent flooding downstream. This time even lower, as back to back events put more flooding risk downstream. The worse it is, the lower the tailwaters will be while areas downstream are struggling with high water.

Once flooding concerns subside they bring the outflow back up, WAY up, and keep it there for a long time. This is to get rid of all the excess water from the two events combined, and be ready should another come. The worse it is, the longer the high water will last afterwards.
 

Attachments

  • Above Dam.JPG
    Above Dam.JPG
    37.5 KB · Views: 3
  • below dam.JPG
    below dam.JPG
    37.1 KB · Views: 3
If it has water temp, you can see the difference between freestoner and limestoner. This is over a 6 month period, so you can see the difference between summer and winter water temps on two very different kinds of stream. Notice that the year round average is nearly the same.


Attachments

  • water temps_big spring.JPG
    water temps_big spring.JPG
    37.6 KB · Views: 2
  • water temps_straight run.JPG
    water temps_straight run.JPG
    38.5 KB · Views: 2
How bout daily water temps. The trend is similar for virtually all streams, warmest water temps are in the evening. But some streams vary far more than others. Those are the ones where, at certain times of the year, time of day means everything.
 

Attachments

  • daily water temps.JPG
    daily water temps.JPG
    34.7 KB · Views: 5
Unfortunately, they don't have gauges on all waters. And they don't have temperature gauges at all locations where they have flow gauges.

If your stream of interest does not have the info you need, you can pick a similar stream nearby to get an estimate. By similar, I mean similar sized watershed, and no major differences in the amount of forested land in the watershed, etc.

Likewise, if you know the trends, you can see what's going on in another stream in the same watershed. For instance, for Erie, before they put a gauge on Walnut Creek in Erie, I frequently used the Brandy Run gauge to guess what was going on on Elk Creek. It's a trib of Elk. And I know from experience that Brandy Run will peak a full day before Elk Creek, and typically fall and level out 2 days before Elk Creek will after a major event.
 
Thank you to all who have replied on this topic. This is good stuff and has answered a lot of what's been swimming around in my head.

Pcray -

Thank you for the visual examples. I had done a little bit of historical snooping - expanding date ranges and such - but was not getting as much out of it has you have illustrated with these sample charts.

Part of my problem in correlating this stuff is that I live so damned far away from the places I usually fish. The 3-4 hour drive into Utah almost always is preceded by a call to a friendly shopkeeper up in Circleville, Utah (Circle Valley Anglers) who stays regularly acquainted with the streams and rivers I usually hit. Admittedly, I usually just call, and if he says it should be good to fish, I go. If not, I stay home. I'm glad we've gotten more in depth on this because, at some point, I need to become more self-sufficient.

This whole topic is about to become very important as I have a firend flying out here from my old Air Force duty station Nebraska in mid-May to hit the Spring bite up there in utah with me. I don't want to waste his time and the price of a plane ticket running around from one blown out/crappy stream flow to another.
 
Well, I just so happen to be teaching the newbie jam this weekend and made up those examples for printouts, should anyone want to get into it that deeply. :)
 
I think you know by now that I'm a like-minded guy in that regard. I really like to dig a bit into what drives this whole sports outside of just the outward fishing techniques.

Oh, and I meant to ask where you get you water temp data. I must be looking right past it if its on the USGS site.
 
Only some gauges have it. A minority. Scroll down.
 
Ah, ok - I'll check some of the larger Utah waters and see what's up. I'm sure that several have temp readings.
 
You may also have to check some boxes to get different parameters. Height and cfs are the default parameters that are displayed.

Also, some stream data is not displayed on the USGS website in real time and is periodically downloaded.
 
I did notice the parameter check boxes that let you add or subtract info as needed. I also saw that the red start appears on some of the graphs indicating an actual measurement being taken at that time. What's baffling to me is that, thus far I haven't found a single Utah stream that I've fished that appears to offer temp data. I've checked at least 10 rivers/creeks and haven't found any temp data available.
 
Very cool thread, with some really great answers. Time is what's needed to figure it out for sure.
 
Back
Top